[Project] Research on Mesh Adaptive Routing Optimization System Based on Self-Training AI
Jump to:Modeling Paper
Project Documentation & Research Overview
I. Research Background
Current wireless Mesh networks commonly suffer from the problem of “strong signal but unstable connection.” Traditional protocols such as Zigbee and WIFI Mesh rely on a single signal strength factor for routing decisions, unable to comprehensively perceive key factors such as link packet loss rate, physical obstruction, and node load. Once encountering dynamic interference such as wall obstruction or personnel movement, the network is prone to interruption, cannot adapt to changing/complex environments, and is difficult to meet communication needs in special environments.
This project changes the traditional single-factor decision-making model and builds an “AI intelligent decision-making” architecture. By deploying the random forest algorithm onto the ESP32-C6 chip, each node is endowed with the ability to make independent decisions without cloud participation. The system integrates multi-dimensional features such as signal quality, link hop count, node load, and link stability, achieving a leap from “passive connection” to “active optimization,” ensuring that the network remains robust, efficient, and self-healing in complex and ever-changing environments.
II. Project Overview
This project constructs an adaptive routing optimization system based on AI algorithms.
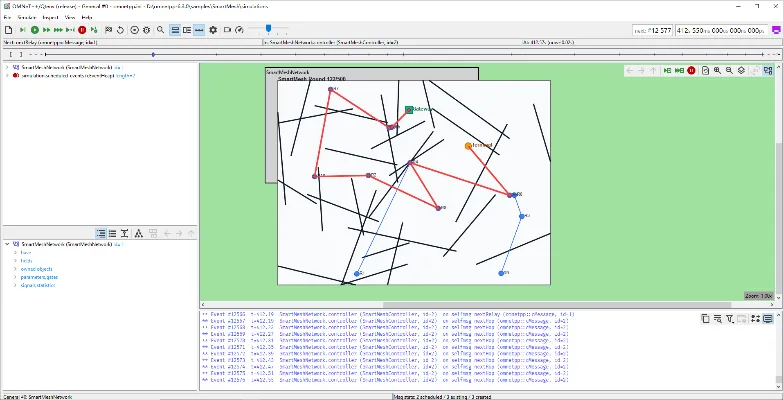
Using the OMNet++ wireless network physical simulation software to construct a scenario containing several walls and communication nodes, 6959 pieces of simulation training data were obtained. Afterwards, the random forest algorithm was used to fit the training set data, yielding a mathematical model with good fitting performance.
This model can be approximately represented by a function (f is approximated by random forest):
After research, the obtained prediction algorithm was deployed to the ESP32-C6 microcontroller and experiments were conducted. The results show that the model derived in this paper can better balance information such as signal strength, link hop count, and node load when selecting parent nodes, thereby choosing nodes with better overall quality for networking.
This algorithm can be applied to scenarios such as rapid networking deployment in large-scale complex environments, and has certain practical prospects.
III. Core Highlights
Multi-feature Fusion Routing Decision
Breaking through the traditional routing method that relies solely on signal strength, it integrates multi-dimensional features such as RSSI, transmission distance, link quality, and energy consumption to improve path decision accuracy.
Modular Intelligent Networking
Each ESP32-C6 is an independent unit, and units communicate and negotiate with each other. Through the trained decision model, node quality indicators are inferred by comprehensively considering various aspects of actual data, ultimately forming an optimal topology network.
After networking, whether it is ESP32 (C6/S3/C3/8266), or mobile phones, tablets, and computers, all can access the network through these nodes. At this point, these nodes serve as network relay routers.
Training a Machine Learning-Based Fitting Prediction Model
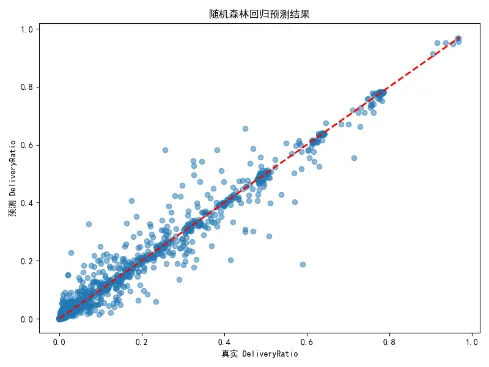
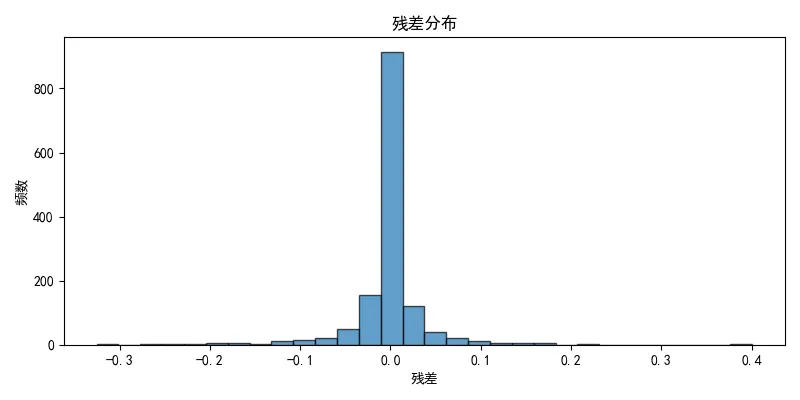
Data was collected through the OMNeT++ wireless physical simulation tool, and the random forest was used to train the routing selection model. The coefficient of determination:
Achieving high-precision path quality prediction.
AI Edge Deployment
Deploying the model to ESP32-C6 nodes enables local real-time inference without cloud participation, improving the model's decision response speed and convenience.
3D Modeling Printing + PCB Design
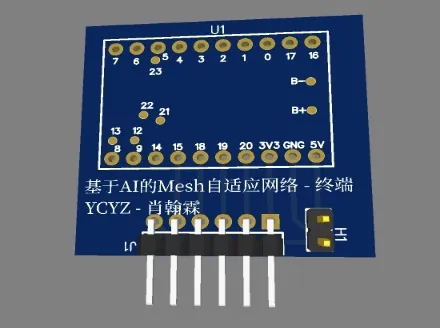
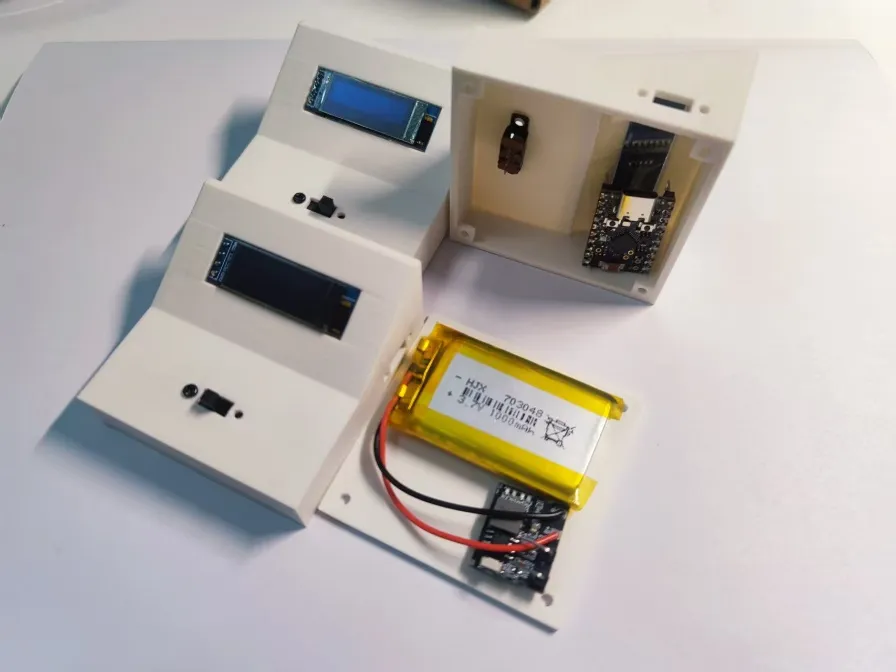
3D modeling printing technology will be used to design the terminal enclosure, integrating a lithium battery and charge/discharge module. By soldering various components onto a designed and prototyped PCB circuit board, circuit integration is achieved.

Real-time Cloud Data/Structure Monitoring
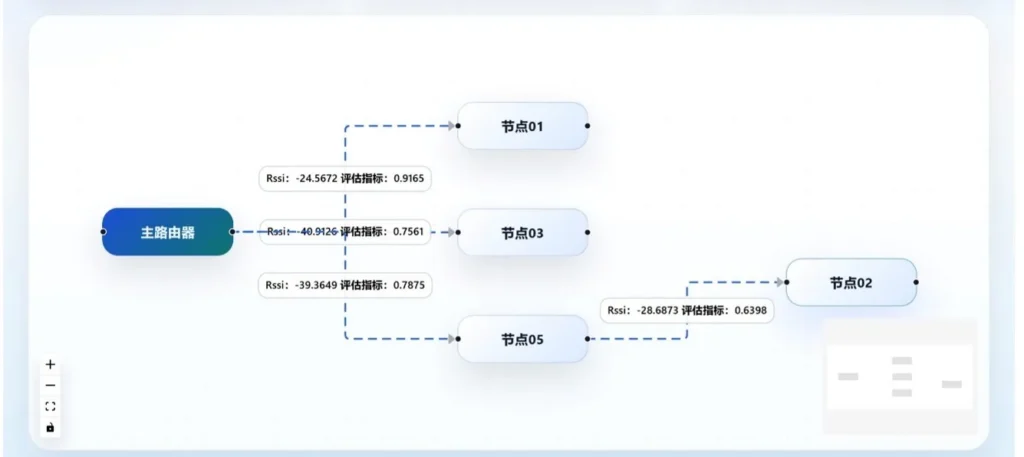
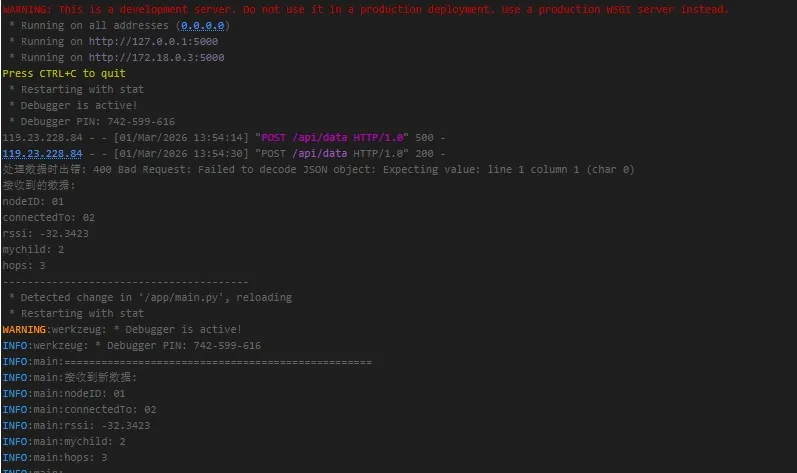
Combining the Python Flask framework to build the server side (backend), and deploying the server via Docker containerization on a Linux cloud server (Debian-12.0), with the frontend page written in Vue.JS, real-time monitoring of network topology structure and node information is achieved.
IV. Comparison Diagram with Traditional Network Connection Methods
Normal Situation
Possible Unexpected Situations (Signal Blockage or Weak Signal Due to Long Distance)
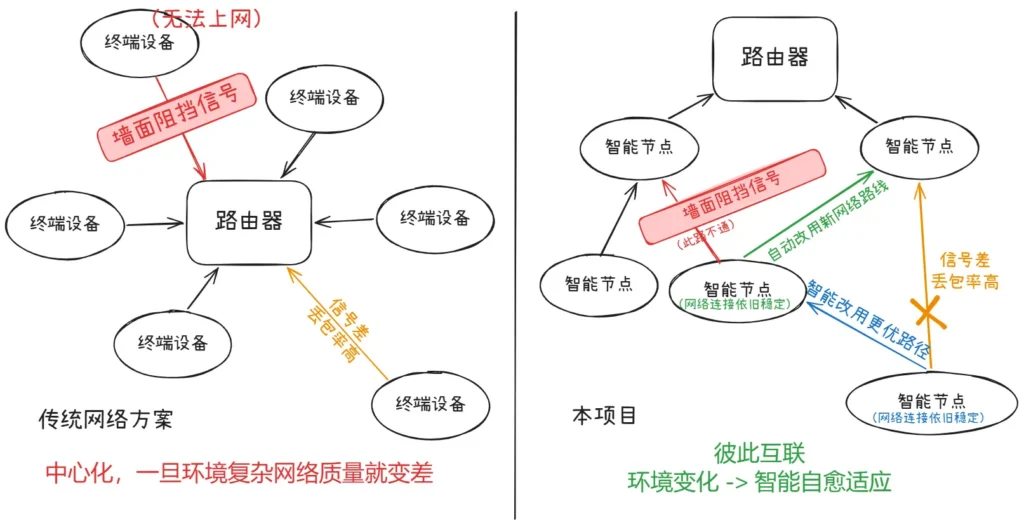
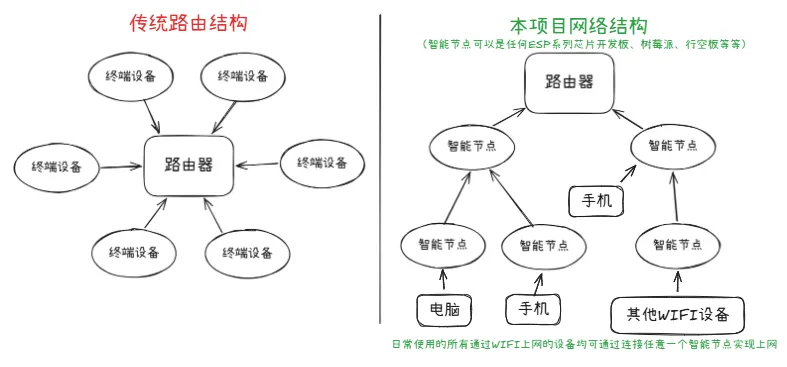
Comparison Diagram 1, 2: This innovative solution has obvious advantages. Due to the integration of a trained AI model, this project has the ability to adapt to the environment and automatically optimize the network topology structure in changing environments, possessing stronger adaptability, flexibility, and foresight.
V. Application Prospects
- Emergency communication at disaster sites (no base station environment)
- Smart IoT networks
- Industrial low-power monitoring networks
- Smart home self-organizing networks
Research Log
One: Topic Selection
Current Status:
Currently, wireless Mesh networks commonly exhibit the phenomenon of “strong signal but unstable.”
The Problem:
Traditional protocols rely on a single signal strength for routing selection and cannot comprehensively perceive key factors such as link packet loss rate, physical obstruction, and node load.
Research Goal:
Build a robust, efficient, and self-healing intelligent Mesh network system.
Two: Simulation Environment Construction, Data Collection
Select OMNet++ wireless network physical simulation software to construct the scenario.
The simulation logic is based on the following assumptions:
- The scenario is a two-dimensional room, and the gateway, terminals, relays, and walls are all randomly generated in each round.
- Walls are simplified as line segments. Whether a link “passes through a wall” is determined by line segment intersection, and signal attenuation accumulates linearly with the number of walls crossed.
- The network is a tree structure, with the main gateway as the root node.
- Hop count is defined as the path length from the relay to the gateway (relay hops), and the number of child devices is defined as the number of direct child nodes of that relay in the tree.
- The attenuation effect of walls on signals is calculated using a modified model of the log-distance path loss model.
- The more child devices a relay node has, the greater the node load, and the higher the probability of data packet loss.
- Data packets have a certain possibility of loss during each relay forwarding process.
Based on the above assumptions:
Use C++ to write the simulation logic, including random environment generation (gateway, terminals, relay nodes, and wall positions), RSSI and hop count calculation for paths from terminals to each relay and from relays to the gateway, the impact of child device load on link success rate, relay probabilistic packet loss, statistics on the simulation's data packet delivery ratio, and CSV result output (RSSI, hop count, number of child devices, node-to-gateway packet loss rate, delivery ratio).
Three: Data Processing, AI Model Training and Optimization
(1) Data Preprocessing
The data contains a total of 6959 records, and each record consists of 5 fields:
- Signal strength (RSSI_dBm)
- Node hop count (HopCount)
- Number of node child nodes (ChildCount)
- Node-to-gateway packet loss rate (NodeToGatewayLossRate)
- Terminal data packet delivery ratio (DeliveryRatio)
Among them, RSSI_dBm, HopCount, ChildCount, and NodeToGatewayLossRate are used as features.
The terminal-to-gateway delivery ratio DeliveryRatio is used as the label (target variable) for model prediction.
Read the csv data through the pandas library in Python.
(2) Split the training set and test set.
Randomly split the data with 20% as the test set and the other 80% as the training set.
(III) Algorithm Fitting
Using the scikit-learn library in Python, construct linear regression, polynomial regression, and random forest algorithms respectively.
(IV) Result Analysis
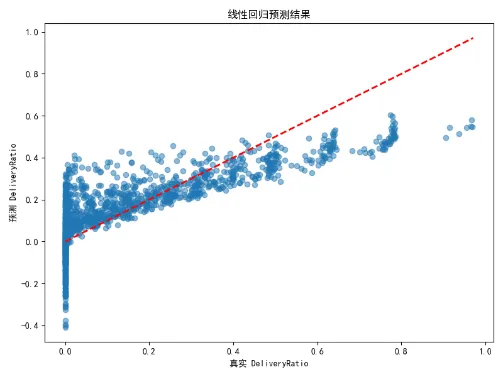
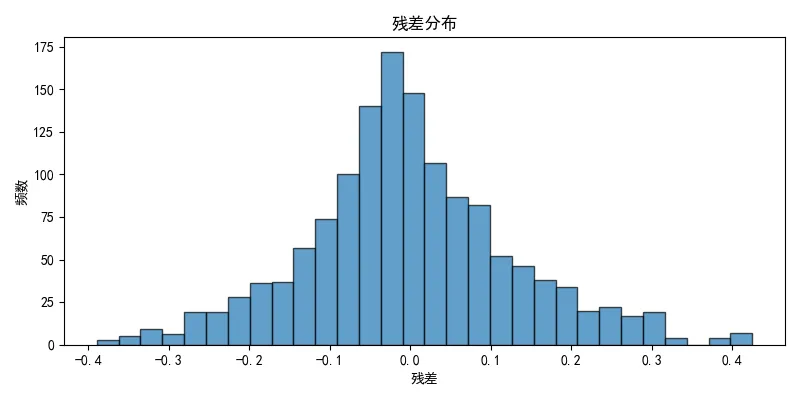
(1) Linear Regression
The fitting effect is relatively weak, and the linear relationship between feature data and label data is not obvious.
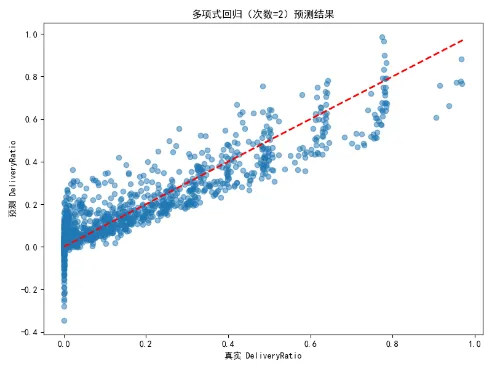
(2) Polynomial Regression (Quadratic)
According to the graph, the fitting effect is slightly better than linear regression, but negative values appear in predictions where the true values are small, indicating overfitting in the model.
(3) Random Forest
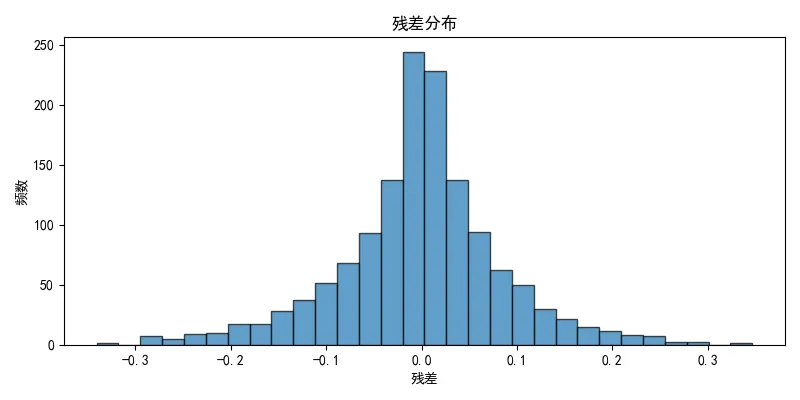
Since there is a nonlinear relationship between features and labels, and noise exists in the samples, analysis shows that this algorithm is a prediction method that meets the requirements.
IV: Hardware Development and Deployment
Core:
Select the ESP32-C6 microcontroller as the core control unit. Deploy the trained prediction algorithm to the ESP32-C6 node. Improve the basic logic.
Structure:
Use 3D modeling and printing technology to design the terminal enclosure. Complete PCB circuit board design and prototyping.
Functions:
Integrate a lithium battery and charge/discharge module, switch, and OLED screen.
Networking Capability:
Each ESP32-C6 is an independent unit, communicating and negotiating with each other to form an optimal topology network.
Compatible with the ESP32 series (C6/S3/C3/8266) and terminal access from mobile phones, tablets, computers, etc.
V: Cloud Monitoring System Construction
Backend:
Build the server side using the Python Flask framework.
Deploy it on a Linux cloud server (Debian-12.0) through Docker containerization.
Frontend:
Use Vue.JS to write the frontend pages.
Realized real-time monitoring of network topology and node information (including display of data such as node ID, number of sub-devices, packet loss rate, RSSI, etc.).
Backend logs can record data reception in real time (such as POST /api/data request handling).
VI: Optimize the System and Fix Issues
Organize the programs of each part, find and fix logic and detail errors, optimize the system, and add some meaningful functions at the same time.